staggeredsix


- Posts
- 5
The Staggeredsix Data Logger is a simple browser-based tool for visualizing VCDS and OBDeleven log files. It automatically converts CSV log data into clear graphs, statistics and parameter comparisons.
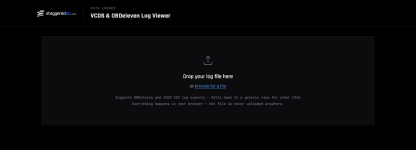
The viewer automatically detects the log format and displays useful information such as duration, sample count, peak RPM, boost pressure, throttle position, lambda values and ignition retard events when those parameters are available.
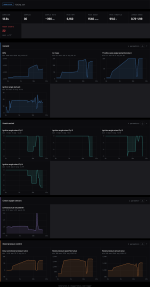
Graphs can be zoomed and moved along the timeline. Use Reset Zoom to return to the complete log view. The complete report, individual groups and comparison graphs can also be exported as PNG images.
Privacy: All processing happens locally in your browser. Your log file is not uploaded to a server.
How to Load a Log File
- Export your log from VCDS or OBDeleven as a CSV or TXT file.
- Open the VCDS & OBDeleven Log Viewer.
- Drag the file into the upload area or click Browse for a file.
The viewer automatically detects the log format and displays useful information such as duration, sample count, peak RPM, boost pressure, throttle position, lambda values and ignition retard events when those parameters are available.
Compare Logged Parameters
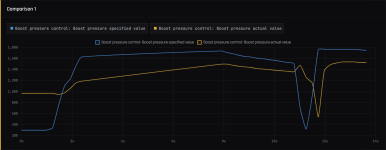
The Comparison section lets you display multiple parameters on the same graph. This is useful for comparisons such as requested versus actual boost pressure.Graphs can be zoomed and moved along the timeline. Use Reset Zoom to return to the complete log view. The complete report, individual groups and comparison graphs can also be exported as PNG images.
Privacy: All processing happens locally in your browser. Your log file is not uploaded to a server.